Rubisight annotation feature empowers users to enhance their visualizations with valuable context and commentary. Annotations enable users to add comments, notes, and insights directly into their visual representations.
How to use it:
- Click on the visualization to which we want to add annotations.
- Example, suppose we’ve created a line chart or any other chart showing our sales is going higher or lower; we can add annotations to explain why the sales are higher or lower during a particular period compared to others.
- We can also include the reasons for the higher or lower sales.
- Click to Save the annotation to the visuals
Additional feature:
• We can write mini-summary to the visuals using annotations.
• Later, we can edit or delete our annotations at any time.
• Annotations are visible to everyone who has access to the visualization.
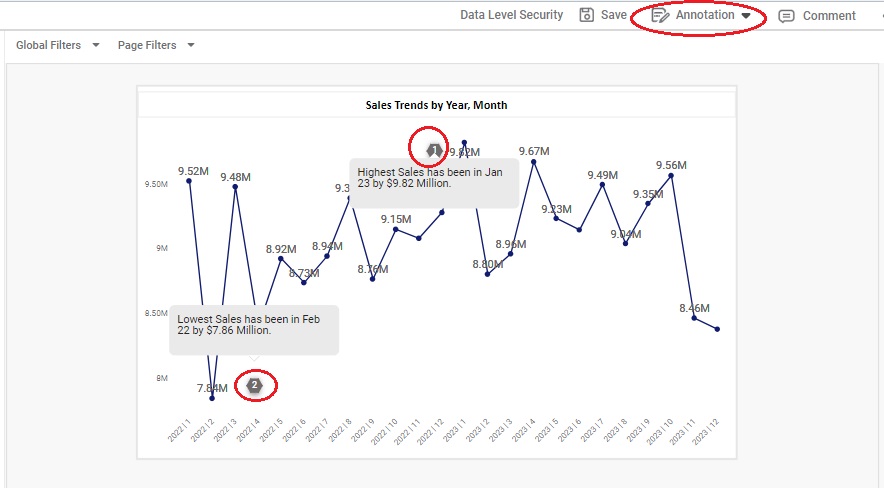
Here is the example to how annotation looks like: