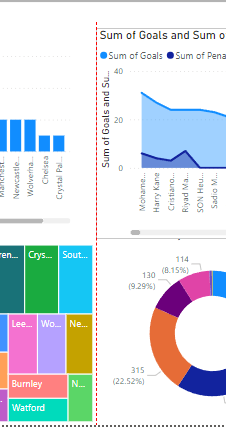
- Visual Alignment Lines: Precision with a Click
Imagine aligning objects across multiple charts seamlessly. That’s the magic of Visual Alignment Lines! This nifty feature lets you connect data points between different charts, highlighting trends and relationships with laser-like focus. No more manual adjustments, just effortless precision for impactful presentations.

-
Offline Powerhouse: Work Uninterrupted
Who says data insights stop when the internet does? offline capabilities will keep you productive even without a connection. Downloading your projects and working seamlessly, will the most of your travel time or those precious moments away from the grid. When you reconnect, your changes sync automatically, ensuring a smooth workflow. -
Creating Custom Visuals
Standard visualization options provided by Rubisight are incredibly versatile and cover a wide range of scenarios. However, there are instances where users may require visuals that are tailored to their specific data or project requirements. Whether it’s a unique chart type, a custom-designed infographic, or a branded visualization template, custom visuals offer the flexibility to address these needs effectively. -
Streamlining the Formatting Process
In the fast-paced world of data visualization, time is of the essence. Creating compelling visuals efficiently is paramount, yet ensuring consistency across multiple elements can be a tedious task. This is where the Format Brush comes to the rescue . This same tool can be implemented to enhance Rubisight for swifter use case among the users.