Question - For example, I have 10 records. 7 of which are ok, 3 are not ok. On dashboard I want to show count and aggregated values for 7 and 3 respectively. And details of 3 or 7 records should be available on user demand.
There are two ways to drill down in Rubisight.
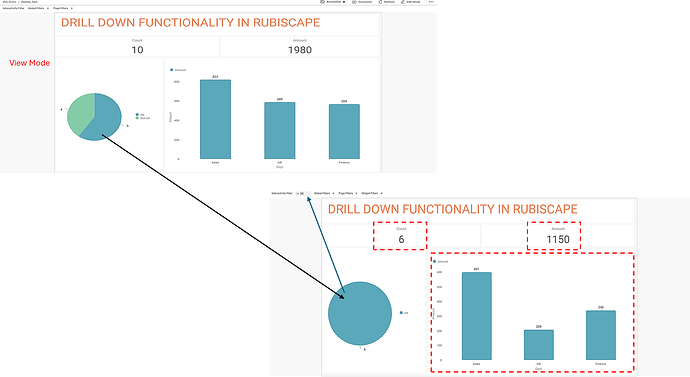
1st One - You create all the charts and graphs and save and go to the view mode. Once you click any chart, automatically all the charts in the dashboard will get filtered with respect to the selection that you have made.
In the example on the image the dashboard is created and opened in the view mode. Once the user clicks on the OK on the pie chart automatically all the other charts gets filtered as per the selection which is marked in red. In similar way a user can select another chart and can drill down further.
To drill back the user click on the selected bar which the user has selected or from the top where the filters got applied, from their the user can remove and drill back.
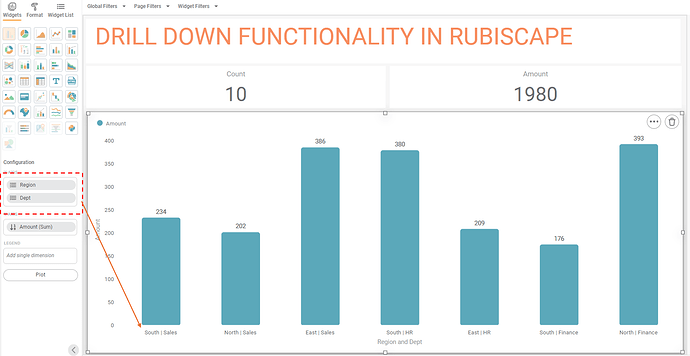
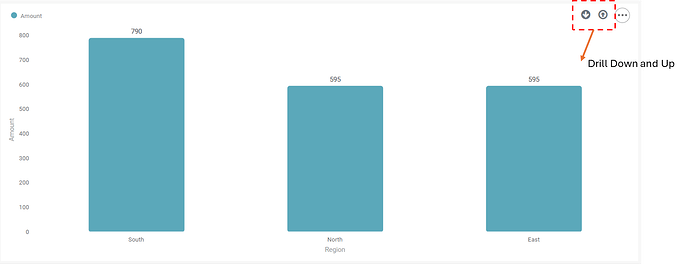
Step -2 - Another way is to put multiple dimensions in the same chart only. And again in the view mode, there will be a drill option once the user selects the chart.
Only in the View mode the user will get the option to drill down and show the details once they click on the chart -


