The RubiThings product is designed to work in 2 modes.
- Configuration mode:
This is more of an admin or configuration mode which is used for setting up essential parameters like
- Data storage to use (Structured / Unstructured)
- Data template definition
- Things registrations
- Business Rules
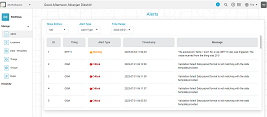
- Alerts alarms configuration
- Locations and Groups
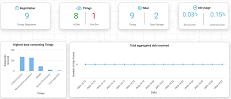
- Runtime mode: This is the mode of a user of the system who will
-
View reported data
-
Monitor alerts and notifications
-
Perform subsequent required actions
A key requirement of this role is ability to monitor data in real-time
.Some critical applications or scenarios where this is needed are NOC operations, Server monitoring*`, Process monitoring (Industrial as well as BOTs)
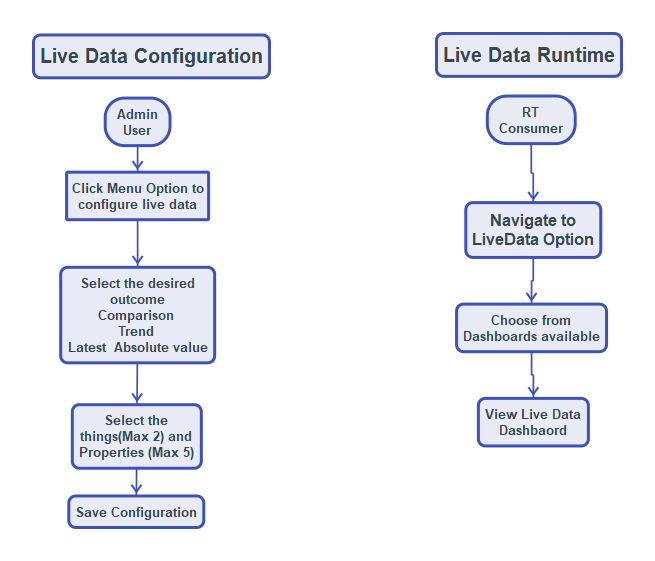
The RubiThings accelerator will enable this with the following 2 step approach.
Providing the admin user a canvass to prepare this live data dashboards
Provide the other respective stakeholders an interface where these dashboards will be rendered…
During configuration , the administrator will have a choice of things and properties. These will be used to create dashboard as per the requirement, rather than a standard display offered.
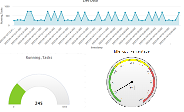
To make things easy to use the administrator has a choice of plotting comparisons or trends or absolute values.
Depending on the choice the appropriate chart will be automatically populated.
Limits:
Currently we will be restricting the choice to two things and max of 5 parameters.
Below please find the process flows for setting up as well as consuming live data dashboards.
D3.js will be used to create the canvass and render the charts for viewing live data