Suppose we have once ingested any dataset using “Data Connect” and created few visuals on dashboard using “Dashboard Designer”. Dashboard is ready to get some insight, but now we wish to make some changes in raw dataset (Ex: Adding to columns, removing some unnecessary rows, etc.) this may impact to create whole new project i.e. ingesting new dataset, creating dashboard on it from beginning.
But the solution lies within Rubiscape and it is way smart. So, to tackle this, after first ingesting the raw dataset using “Data Collect”, Next step should be to use “Metadata Manager” that will create Data Dictionary and select the dataset ingested. Then you can start creating dashboard in it. Suppose you made some changes in local dataset then all you must do is to update that dataset into “Data Collect” then get it updated into “Metadata Manager”/ Data Dictionary. Hence the already created visuals will remain the same and further we are able to have new dimension/measures as updated in dataset to be able to use to get more insights.
Pls refer below images for better understanding:
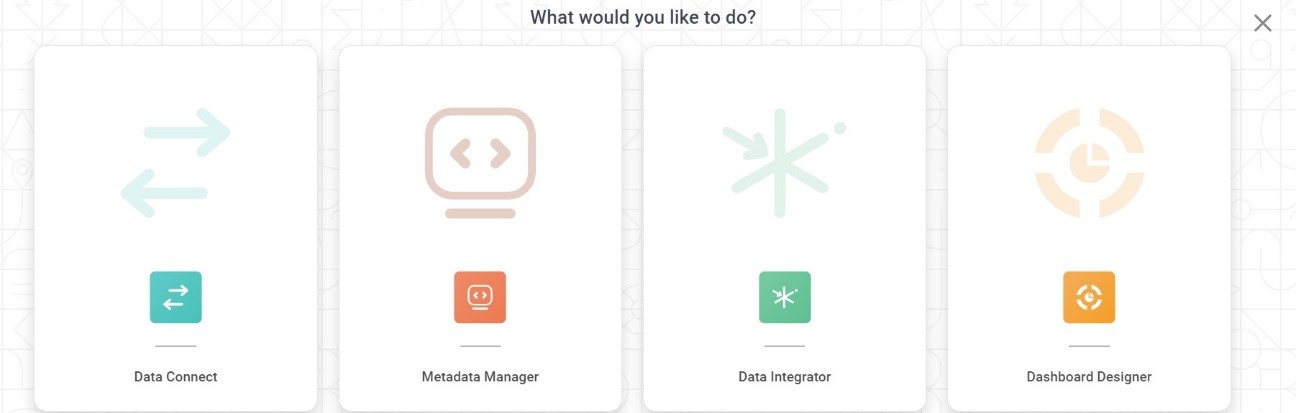
- Tools to be used of RubiScape:
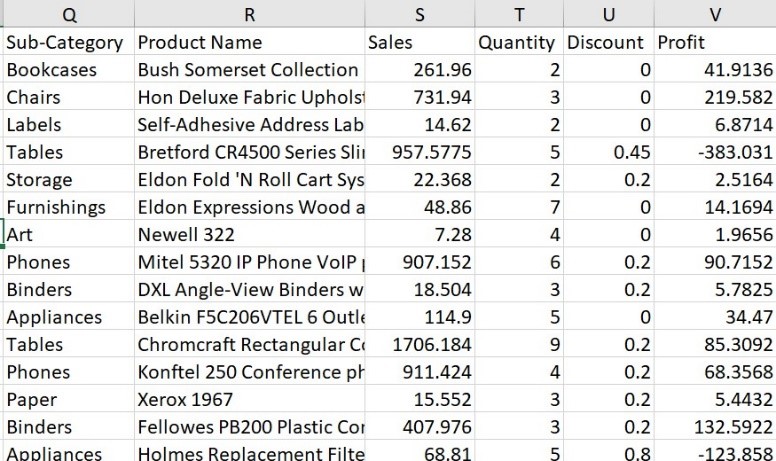
- Existing Data in raw dataset
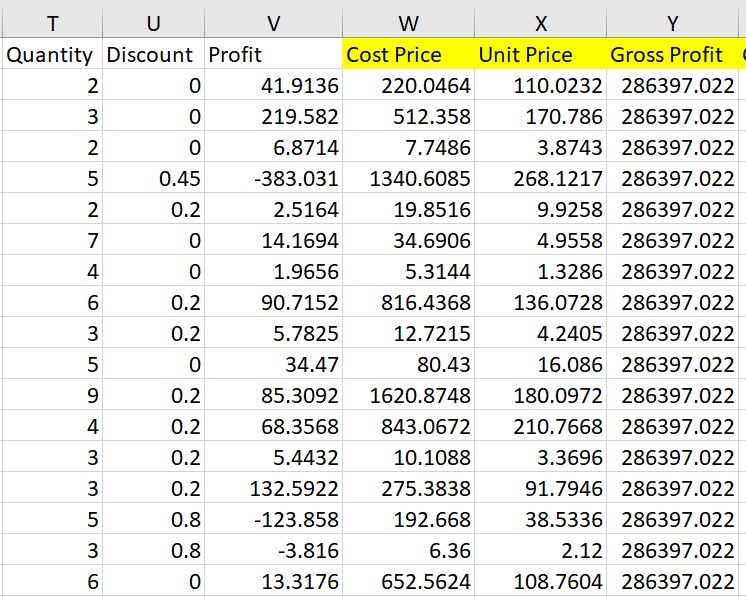
- Calculated additional column created in raw dataset (Highlighted in Yellow)
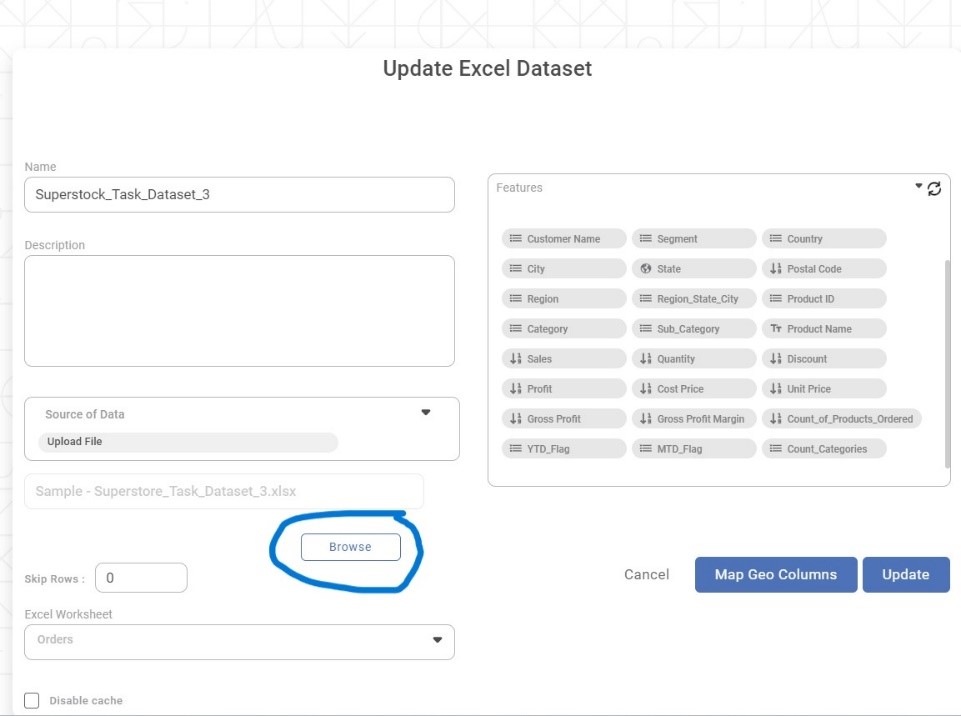
- Update the dataset file into existing dataset on RubiSight
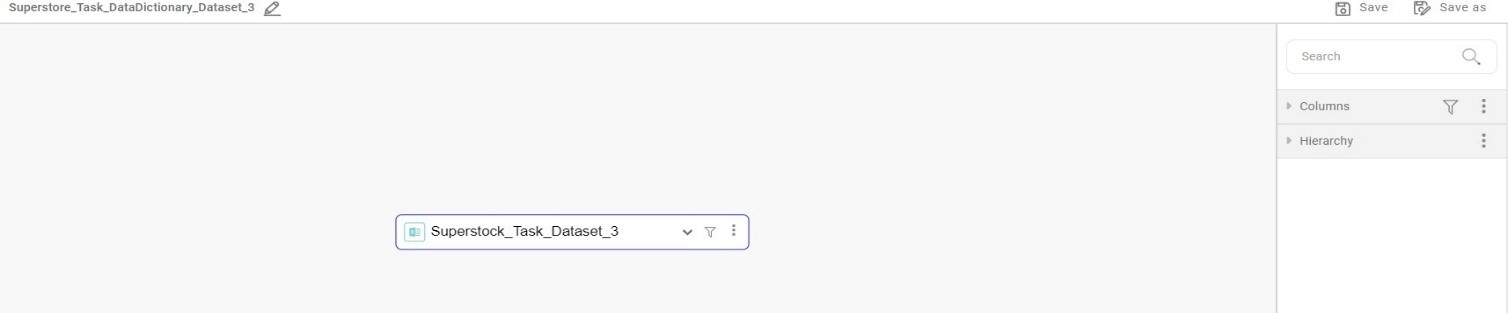
- Updating it into Metadata Manager (this creates data dictionary)
Into Metadata Manager check and update below dataset as follow:
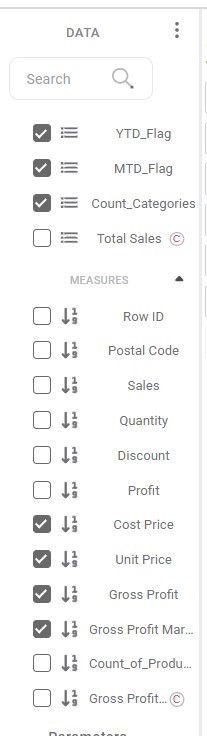
- Now, visit to “Dashboard Designer” existing dashboard created and it will display added columns in measures and dimensions as below (Tick Marked are additional columns that are not disturbing existing visuals):