The Top N/Bottom N refers to the top (highest/largest) N values and bottom (lowest/smallest) N values or ranks in the aggregated values of the selected measure in the dataset. For example, if N = 15, then corresponding to a particular variable, we are referring to the top 15 (or bottom 15) values in the dataset, sorted in a definite order.
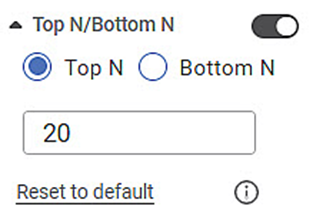
By default, the value that appears in the number space is 20. You can manually change it as per your requirement.
For example, if the value is changed to fifty, the top (or bottom) fifty values are displayed.
- First, the sorting is done, and then top N / Bottom N is evaluated.
- If multiple measures are configured, then only the first measure is considered for sorting.
- If the top 50 is asked to show while data consist of only forty values, then only forty values will be visible.
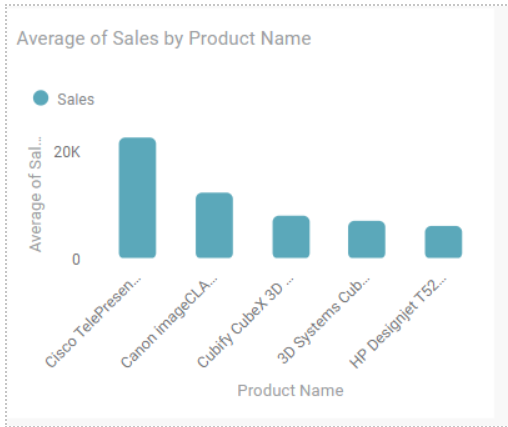
Like here you can see average sales for all the products, we can restrict the result by using top or bottom N.
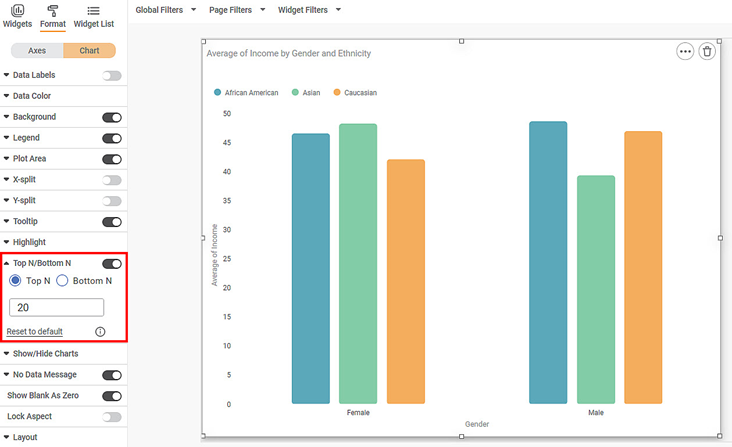
Here I have enabled Top N/Bottom N option which is available in the chart section of Format, after enabling it we can select top or bottom and insert a value, here I have selected top 5 values and this is the result.
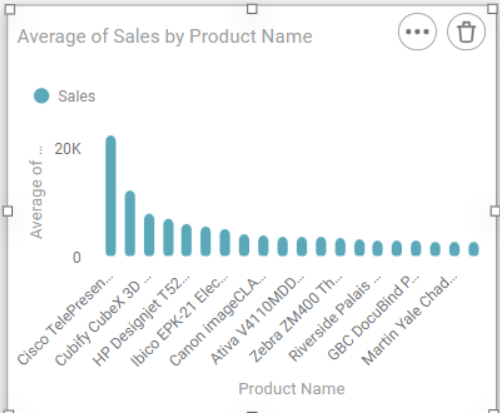
These are the top 5 products.
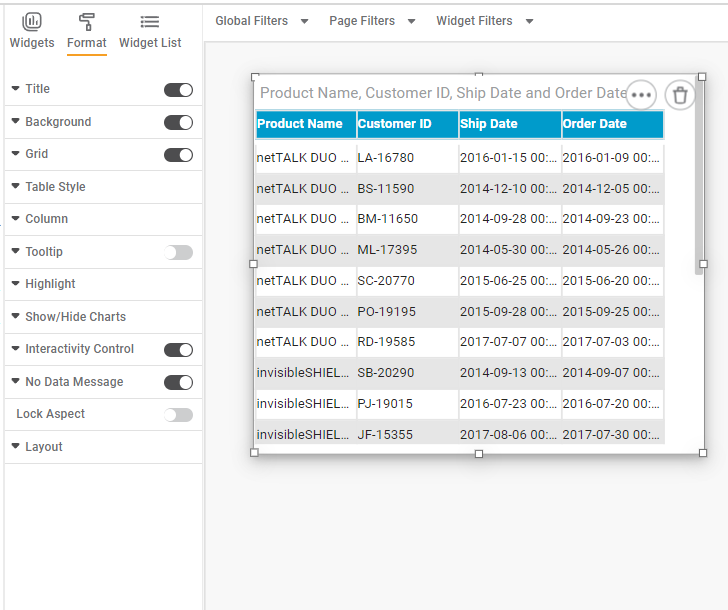
Top N Bottom N option is not enabled for tables.