Uncover Deeper Insights with Overlapping Widgets in Rubisight
Imagine seamlessly layering data visualizations for richer storytelling. Rubisight’s overlapping widgets unlock this power, letting you create impactful, layered narratives.
Key benefits:
Reveal hidden connections : Overlay charts to expose relationships invisible in separate views.
Boost comparisons : Effortlessly compare datasets or variations within one dataset. Gain deeper understanding by overlaying charts, facilitating analysis.
Maximize space : Overlapping widgets efficiently utilize screen space, letting you display multiple charts without clutter.
Highlight key trends : Focus viewers’ attention by placing a smaller chart on top of a larger one, emphasizing specific data points.
Create interactive experiences : Use buttons or controls to switch between overlaid charts, giving viewers dynamic exploration power.
Get started in simple steps:
1.Add Parameters.
2. Select Parameter widget and link
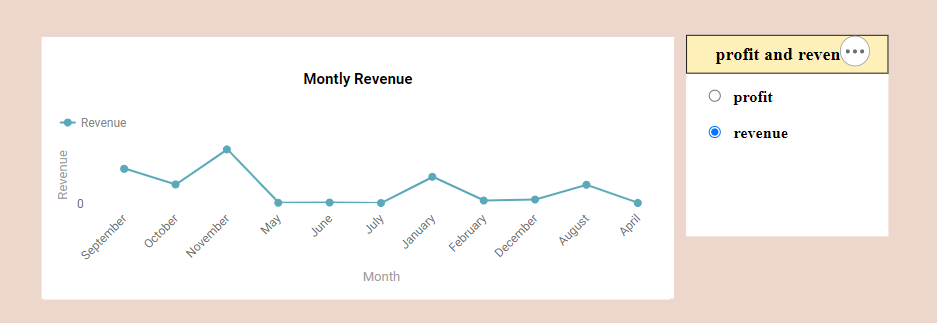
3. View the overlapping visuals by just clicking the radio button
**
Start layering your data stories today with Rubisight’s overlapping widgets!